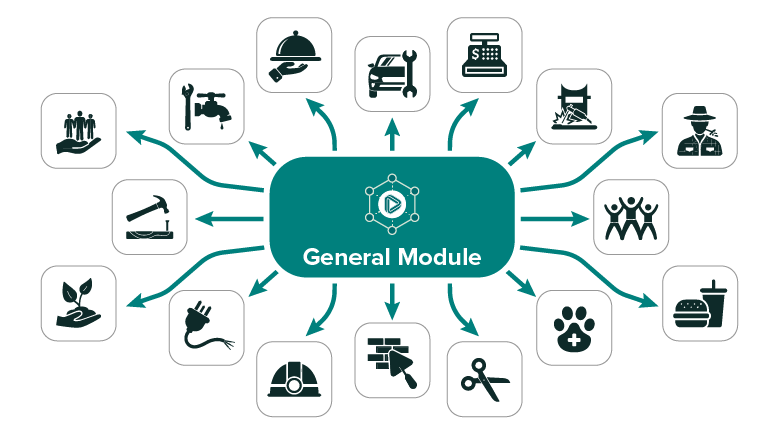
General Module
Learn key information every worker should know. Complete this part before moving on.
SmartMove
Industry modules for essential work health and safety knowledge to stay safe and confident


Learn key information every worker should know. Complete this part before moving on.
Choose a module that fits your job or interests and learn what safety looks like in your world.

Complete both modules to earn a certificate that proves you're ready to work safely and confidently.

Get practical
Complete the general module, then select one or more industry modules
10 elements
7 elements
8 elements
7 elements
6 elements
7 elements
7 elements
8 elements
8 elements
8 elements
8 elements
7 elements
7 elements
7 elements
7 elements
Begin your work health and safety journey with SmartMove

About 15%
are under 20.
That's thousands of teens already gaining real-world experience in the workforce.
are aged 20-24
Young adults are making their mark across industries in Western Australia.
48% female, and 52% males:
Young workers are almost evenly split by gender, showing diverse representation across the workforce.
13%
of work-related injuries in the WA workforce happen to young workers
On average over five years, young men faced higher injury risks at work compared to young women
Male: 67% Female: 33%

New to the job? It’s easy to miss hazards or skip safety steps without proper training.
Wanting to impress can lead to saying yes to unsafe tasks or staying quiet about hazards. SmartMove helps you build confidence to speak up.
Young workers often have casual or temporary jobs with less supervision and missing safety gear or procedures.
Did you know?
These are the top hazards linked to injuries in young workers, based on five years of total claims in Western Australia.


Source
WorkCover WA claims data (2019–20 to 2023–24p), analysed by WorkSafe WA, 2025.
Notes
Own your safety
Start your learning with SmartMove and working towards your certificate of completion.